Quantifying Data Center Carbon Footprint with Fyrefuse
Companies globally are taking increasingly ambitious action to tackle the carbon emission problem. While trying to assess current best practices, they have identified data centers as one of the fastest-growing sources of energy consumption. Our team has developed a B2B2C use case aimed at leveraging data center service providers’ climate sustainability strategy to promote data center services to new customers.
Indeed, according to a U.S. Environmental Protection Agency (EPA) report, the evolution of data centers consumption varied from 61 billion kilowatt-hours of power in 2006, (1.5% of all power consumed in the United States and a cost of $4.5 billion) to almost 104 TWh by 2020.
The rapid change in the number of resources needed for handling data led to an increase in data centers’ size and thus to more emissions. Moreover, the increasing demand for data creation, transformation, and storage from existing and innovative technologies, such as social networks, autonomous vehicles, and artificial intelligence, has led to exponential growth in data center workloads and compute instances.
Before analyzing possible solutions, let’s define some key indicators.
First of all, the Power Usage Effectiveness (PUE) is an indicator of the energy efficiency of the data centers. Companies are trying to adopt a ratio as close as possible to 1. Specifically, it’s the total power supplied to the data center divided by the power consumed by the IT equipment.
Another key metric is the Carbon Usage Effectiveness (CUE) which analyzes the number of greenhouse gases produced by a data center.
The servers crave huge amounts of energy for computing which in turn is dissipated as heat within a relatively small area. Cooling plays an important role since the heat must be continuously removed to avoid damages to the hardware.
As illustrated in the figure below, the energy requirement for cooling typically accounts for a large share of the overall energy consumption in data centers.
Cooling solutions and location cover an important role in assessing energy usage: colder places require fewer investments in cooling.
The cooling reduction is not the only way to reduce carbon emissions. Companies can also try to exploit potentially wasted heat either by directly utilizing dissipated heat or indirectly through conversion to other energy forms, such as produce cooling.
Measuring carbon footprint with Fyrefuse
Carbon footprint is a concept used to quantify the impact of an activity, a person, or a country on climate change.
Our team has developed a B2B2C use case aimed at leveraging data center service providers’ climate sustainability strategy to promote data center services to new customers.
Data Center Service Providers continuously try to promote their eco-solution to the potential end customers.
In particular, the use case showcases:
- How a potential end customer can quantify the current CO2 footprint of its servers;
- How to compare the current CO2 footprint of a potential end customer to an equivalent infrastructure of the data center provider;
- How to obtain a CO2 footprint reduction forecast by migrating to the data center provider.
Benefits
With the Fyrefuse-powered interactive dashboard, data center provider companies can have a direct overview of end customers’ total emissions and carbon hotspots within their own IT infrastructure.
Moreover, they can enhance the value proposition by calculating the environmental advantage of their solutions rather than industry competitors.
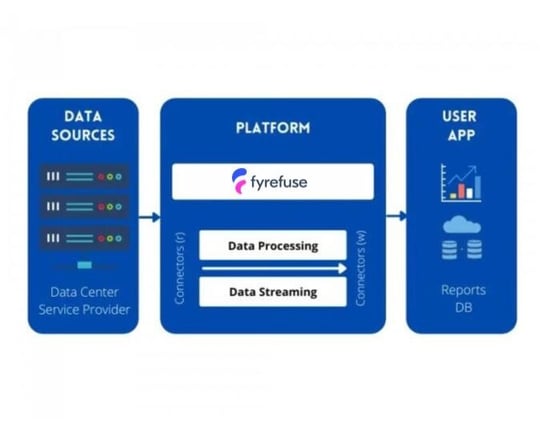
Finally, data center service providers have the possibility to constantly monitor streaming pipelines and data operations both on-prem and in Cloud with HA-ready configuration on Kubernetes.
Discover more business gains that Fyrefuse can bring to your company in this article.
Leveraging DataOps with Fyrefuse
This use case leverages Fyrefuse’s codeless agility and easy-to-run pipelines to power the dashboard for IT infrastructure carbon footprint assessment. To start, the potential end customer provides key numbers on servers, CPUs, PCI slots, memory, the number of disks, fans, and the percentage of workload on which the server is running.
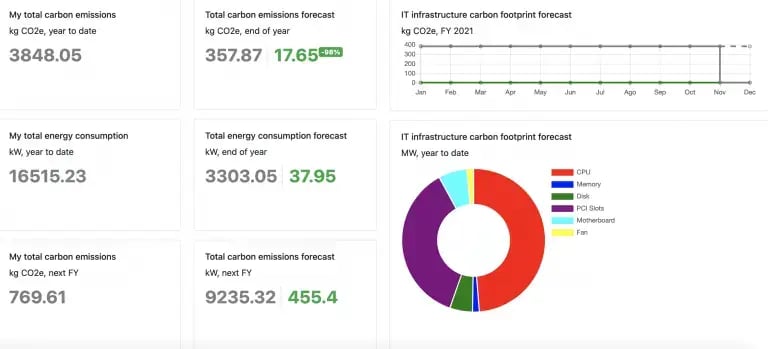
Once the potential end customer has inserted their data, the dashboard will present the analysis results along with a forecast compared to the client’s data center architecture.

The dashboard can be divided into two parts:
- On the left side, the user is given key metrics on energy consumption and emissions with comparisons between potential end customer’s current numbers and a simulation of possible reduction in case of switching to the client’s data center architecture.
- On the right side, the user can see the IT infrastructure CO2 footprint forecast and the energy consumption breakdown.
One solution, many use cases
This solution finds a possible adoption in many business sectors.
In terms of sales, the C02 Calculator highlights the savings (lower impact in terms of environmental sustainability) for a potential new end customer when switching to the client’s Data Center comparing their current CO2 output to a forecast.
Keeping track of emissions can improve marketing, providing the ability to build a narrative pivoting around sustainability by highlighting the reduced Carbon Footprint of the services in the providers’ portfolio.
Finally, in terms of technology, it provides a view on quantifying the index of effectiveness and environmental impact of the data center.
The near future will be shaped by the growing industry of data centers. And even with measures to enhance their energy efficiency, their share of the global energy consumption will expand in the following years.
A potential key role for data centers as large energy consumers today is to become the energy hubs of tomorrow by analyzing energy consumptions in real-time. Fyrefuse can help manage all telemetry data flows easily and, combined with modern data center technologies, can result in lower consumptions, lower emissions, and thus toward a more sustainable business.
.png?height=200&name=Untitled%20presentation%20(2).png)
.webp?height=200&name=img-01%20(2).webp)


